Line Ton That, our Innovation & Solution Manager Self-service analytics is involved in the Storytelling with Data community during her free time. In this article, she shares her reasons for joining the community as well as a challenge that she particularly enjoyed.
- Hello Line, thank you for giving us some time! Could you please introduce yourself in a few words?
I joined the Positive Thinking Company France in the course of 2021, as an Innovation & Solution Manager. I help our clients with various self-service analytical issues, in other words, business intelligence made available to business teams. I also lead an internal community to capitalize on our knowledge and expertise. As an environmental engineer, I have had the opportunity to analyze many types of data, in various contexts and for different business users (operational monitoring, HR, maintenance, customers, environmental department). During my career at Veolia, I learnt to discuss my analyses with several business profiles and this led me to seek the best way to communicate my results. It is quite naturally that I decided to dedicate myself to data analysis and visualisation. In addition to my professional activity, I invest my free time in the Storytelling with Data community, as data visualization is also a passion.
- How was the Storytelling with Data community born? Could you name its main objective?
The Storytelling with Data community was founded by Cole Nussbaumer Knaflic. Cole Nussbaumer Knaflic specialised in data communication after working in the banking and technology services sector. As a People Analytics Manager at Google, she developed a data-driven approach to build innovative people management programs and practices. Based on this experience, she created the Storytelling with Data community to help professionals around the world inspire positive change through data. She is currently the author of the book “Storytelling with Data: a vizualization guide for business professionals” and contributes to numerous content within the community (podcast, blog posts, and workshops).
The main objective of the community is to bring together different people around a common interest in data communication at all levels. Members have the opportunity to participate in monthly challenges and are encouraged to share their knowledge.
- What are the reasons that led you to get involved in this community?
I wanted to contribute to this community to get out of my comfort zone, on the one hand. The topics of the challenges are very diverse, and this leads me to consider new ways of seeing things, discover new tools, and develop new skills in data visualization. On the other hand, this involvement allows me to learn a lot by exchanging with other data visualization enthusiasts. It is very inspiring!
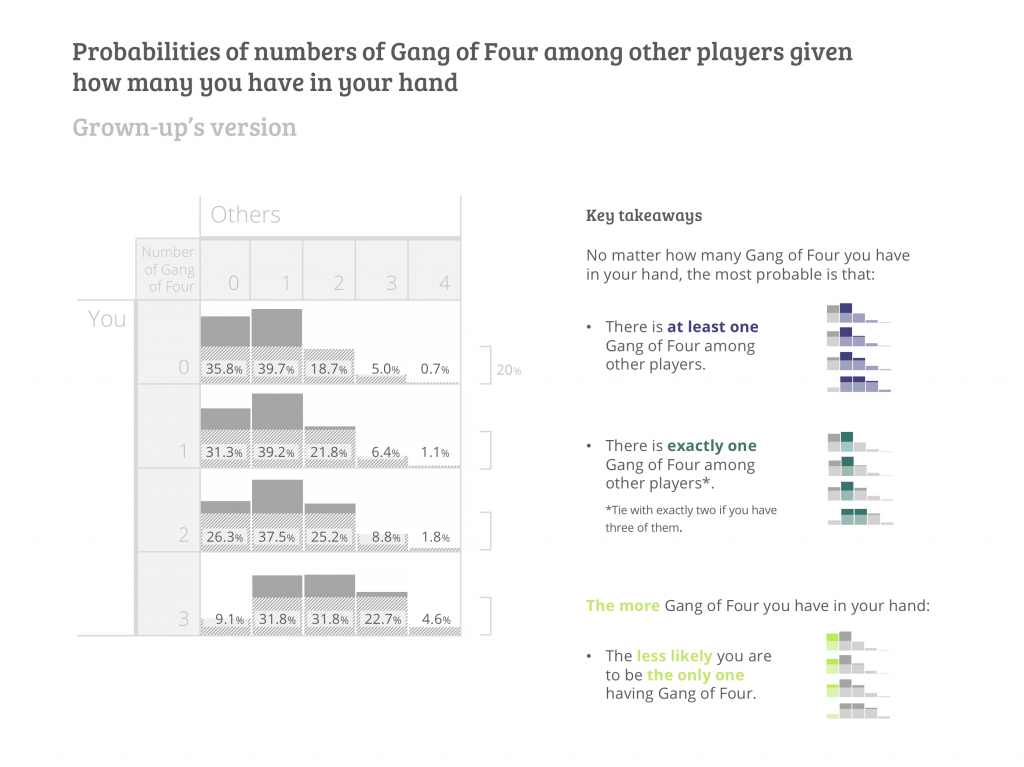
- Can you tell us about a challenge that particularly interested you?
I enjoyed working on a probability table to help players of the game Gang of Four make better decisions. I adapted this datavisualisation work to adult and children audiences. To do so, I researched solutions using hand sketches.
- Thank you Line for this interview! To go further, we invite you to have a look at:
Blog post on Storytelling with Data website
Line Ton That’s Tableau Public profile