This article details how we made the Canal+ churn prediction model explainable. Previously limited to predicting the likelihood of a customer to churn, without any insight as of why they would churn, it is now possible for our client’s marketing teams to get to know the concrete probable reasons making the customer churn, and to take the appropriate actions to retain them.
We present in this article how our Data Science Team managed to unlock the relevance and meaningfulness of a churn prediction model that was used for years by Canal+ International marketing teams. The existing approach could only output the probability of a customer to churn within six months. However, this model was not able to provide with any possible reasons or causes as of why said customer would stop to use the service: in short, the model was just spitting out a number. This naturally led to a relatively low adoption rate by the international marketing teams.
Key Challenges
But first, a bit of context, CANAL+ Group is the leading French audiovisual media group. Present in 40 countries, CANAL+ aims at offering the best in entertainment to more than 22 million subscribers. The company provides television channels accessible only by subscription, together with the most complete streaming platform on the market (MyCanal), which brings together films, series and the best sports competitions live or in replay. It is also well known for their major activity in producing and distributing movies and series.
For some time now, the marketing teams of CANAL+ International have access to a “score of fragility”, which predicts how likely a customer is to churn, from 0% to 100% chance to leave. The score generated by the model is being used to spot the customers who are at bigger risks to leave, and to attempt to retain them through specific commercial offers.
The problem is that the marketing teams only have this number to work on. A number ranging from 0 to 100. No further explanation, no possible causes. So the telemarketers perform random actions, trying to retain customers without clear nor relevant arguments.
Therefore, our client was facing three main challenges:
- Unable to explain the model’s decisions (i.e. why does this particular customer is flagged as “fragile”?);
- International branches were reluctant to use this score because of its unintelligibility, and the fear that the behavior of the model was too much country-specific (i. e. too sensitive to the training data);
- There were very few indicators and metrics usable to improve the model and understand its weaknesses.
In this context, our client wanted to:
- Understand deeply the existing churn prediction model and its predictions;
- Drastically improve the relevance and quality of the telemarketers actions, thanks to concrete bits of knowledge about the customer’s possible reasons to churn;
- Increase the adoption of the model by the international marketing teams, by providing explainability, and therefore understanding of it. This then creates trust in the model.

Our Approach
We implemented our Machine Learning Intelligibility (MLI) solution that consists in a holistic approach that aims at bringing clear and relevant explainability, interpretability, and intelligibility of a Machine Learning (ML) model. The project lasted 8 weeks and was comprised of Data & Model Quality and Relevance assessments, Implementation of Explainibility Indicators, and Industrialization of the explained model, in close collaboration with the IT and Architecture teams.
1. Data & Model Quality Assessments
A comprehensive evaluation of the quality of the data used to train the model, and of the model itself has been conducted. This consists of evaluating the quality of this data, its relevance in the context of the model and thus identifying potential biases (such as the location of people for example). This step is crucial to identify the elements that could impact the ML model and therefore bias the results obtained.
2. Implementation of Explainability Indicators
Once the exploratory statistics and detailed analysis of the data have been thoroughly conducted, we implemented the XAI indicators relevant for the model to be explained. Though this model was of the family of Random Forests models, a family of models that already possess a form of built-in explainability, it was necessary to determine what indicator would suit best the use case’s context.
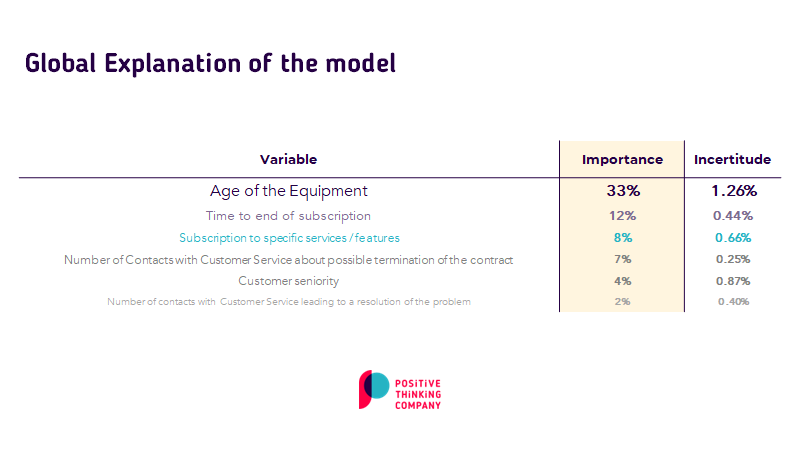
Based on our experience with similar use cases, we chose to use Shapley values for the local explainability, and the PDP & PFI methods for the global explainability. The difference between them comes from the scope of the explanation: a local indicator focuses on single observations (i.e. answering the question of why does John Doe has such high probability of leaving the service?), while a global indicator focuses on the behavior of the whole model (i.e. answering the question of to what variable is the model most sensitive to?).
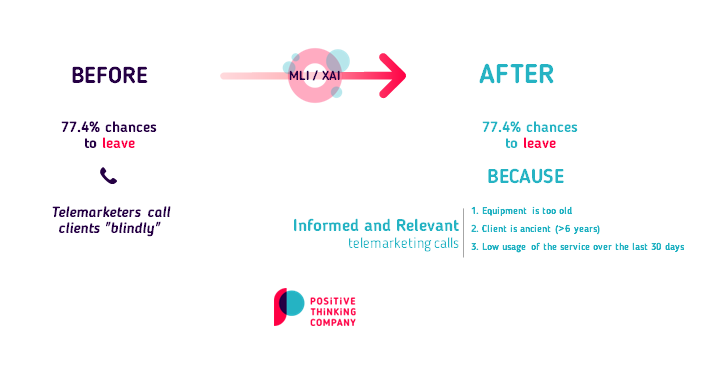
Previously, the model was able to indicate that customer John Doe had a 77.4% chance to churn, which resulted in an action from the telemarketing department , but without any insight or guides about possible reasons for the customer to leave.
After implementing these indicators, it is now possible to indicate the potential reasons that explain the output probability. In this case, John Doe has a 77.4% chance to churn because their decoder is probably too old, because they subscribed a long time ago and have not yet benefited from any promotion. The telemarketing department can now create a tailor-made response to this client such as proposing a replacement of their decoder and a special promotion that rewards their loyalty.
3. Industrialization of the explained model
Once these indicators were implemented, it was crucial to make them available to all the business teams that are using directly or not the churn model. We here supported and assisted the Dev Ops / ML Ops teams of Canal+ International so as to industrialize as best as possible our developments. We took care to provide a code fully compliant with the technical requirements of the IT infrastructure of our client.
Benefits
- +10% of performance in the churn prediction
- Concrete and specific levers usable by all the different end-users of the model (such as the telemarketers) in order to better retain customers
- A model that can be better understood and more trusted by other business teams
- Full explainability of the model with both global and local explanations
- Operationalization of the indicators within our client’s MLOps pipeline
Now, our client is able to see that a customer is ‘fragile’ because they have not used the service for the last 31 days, or because their equipment is too old, for instance.
Since the model was recently put into production, the benefits in terms of improvements in the use of the model and its predictions by end users are not yet known. Please come back in a few weeks time in order to get the latest developments of this hot topic!
Team Involved
A Data Scientist and an XAI Expert collaborated with our client during 8 weeks on this project.
Technologies


Thanks to our
Author