“Not everything should always be looked at from a technical perspective” I was told, and that is exactly the goal of Data Storytelling!
To be understood and assimilated to the point where decision-making is possible, information must be put into context and told as a real story.
The starting point, Dataviz: the art of facilitating the understanding of data
Dataviz, or Data Vizualization in full, encompasses all techniques that represent data graphically to make it meaningful. The practice is not new. It was started many years ago by various researchers. They employed the technique to make data intelligible, promote understanding and thereby allow conclusions to be drawn.
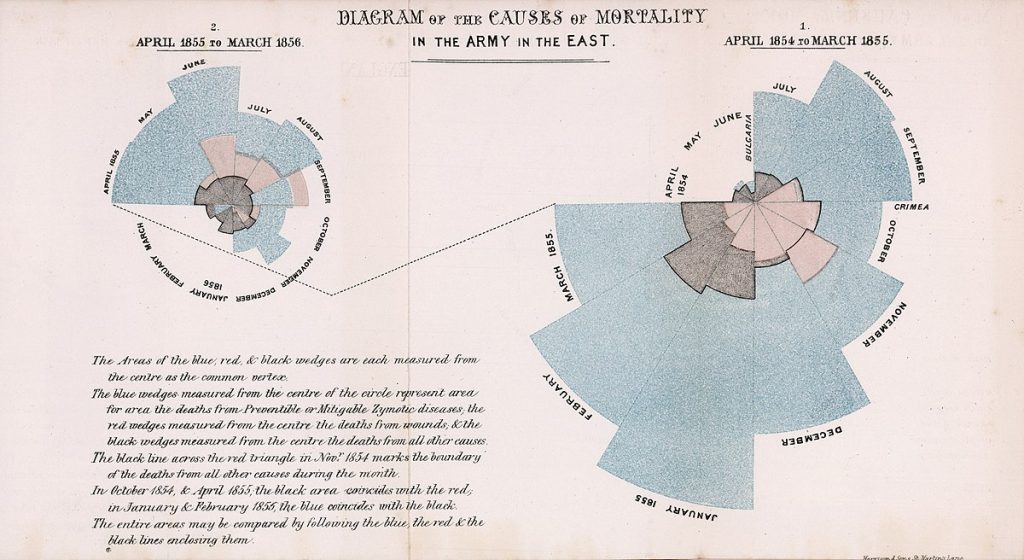
Going back to the 19th century, the graphics produced by Florence Nightingale, in particular, shed light on the main causes of death in the British army in the East. Presented to parliamentarians, unfamiliar with statistical reports, her work would not have had the same impact without this visual representation.
A good, wisely chosen graphic facilitates understanding and makes memorization of the observation more effective!
Dataviz, as we understand it today is omnipresent, driven by the arrival of certain software packages, like Tableau or Power BI, or even the d3.js library. Connected to databases, they allow the creation of dynamic visualizations that can be maintained and updated over time. Easy to implement, Dataviz therefore appears to be an essential technique in the development of ever more numerous data sets.
But is the mere compilation of data in graphical form really sufficient to understand a complex situation?
Data Storytelling: setting the data scenario to give it meaning
A very complex graph can be very difficult to interpret. This is exacerbated if it attempts to answer several different questions. However, to be effective, data must be presented in a simple manner that allows its recipients to assimilate and retain it. This is precisely the role of Data Storytelling. It role-plays the data in the form of scenarios, telling a story to the interlocutor. This incorporates as many possible scenarios as there are angles of analysis.
Telling a story, or putting the numbers into a narrative context, significantly improves the decision-making ability. Nancy Duarte1 reveals that 63% of people retain factual elements if they are integrated into a story. Conversely, the memorization rate drops to 5% when they are presented as raw data, without context!
63% of people retain factual elements if they are integrated into a story
Nancy duarte
Actually doing this is not trivial. It involves questioning all the data. It takes into account the history as well as all the elements of contextual analysis that can uncover unsuspected relationships. For this the help of a Data Scientist or a Data Analyst may be necessary.
The objective? To captivate the reader so that the message and the analysis remain in their memory.
To achieve this, it is important to understand the business context, expectations and objectives of the recipient. Depending on the data available, the right graphical interactions need to be created to result in a logical and effective scenario that answers the questions posed by the interlocutor. Bringing this story to its conclusion is what will promote awareness and help decision-making.
Moving from data to knowledge!
One of the main difficulties in Data Storytelling is to not offer a single, data-oriented vision. It needs to provide an impartial 360-degree view that consists of several distinct angles of view.
When the scenarios are intuitive and accessible (provided that several ergonomic rules are respected), the data becomes information. This information in turn becomes knowledge. This knowledge can then be shared and used to make informed decisions.
Finally, this knowledge is gradually converted into wisdom2.
Be aware that for this knowledge to be credible and irrefutable, it is important to work on quality data and to ensure the reliability of the sources used. From this, one can understand how data quality is a very relevant issue for many companies.
Sources:
1Data Story: Explain Data and Inspire Action Through Story by Nancy Duarte
Thanks to our
Author