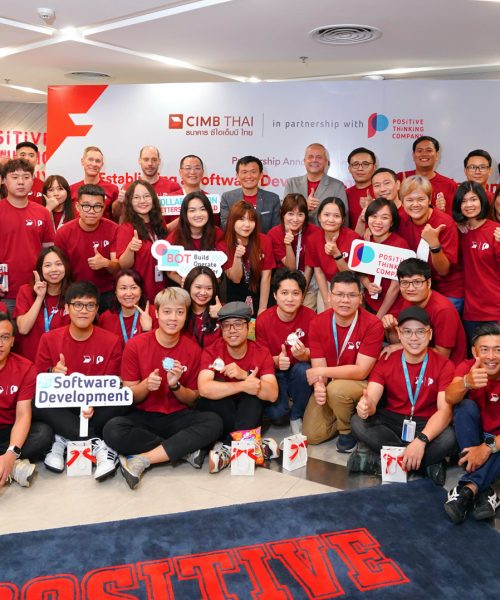
For the 3rd year in a row, Positive Thinking Company Germany teams participated in the Hackathon organized by our partner SAS. This participation is marked by the choice of an important humanitarian topic, building an end-to-end data product aiming at better informing each individual about the environmental risks they face, and the way to protect themselves with micro-insurances, and a winning in the Machine Learning category. Everything you need to know is in this article.
The 2022 SAS Hackathon
Aligned with the SAS core values, the SAS Hackathon aims to inspire global participants to be curious, passionate & accountable. This year, seventy qualified teams from all over the world participated in the event during March this year. Each team had access to a SAS mentor, a learning portal and the ability to try modern techniques such as machine learning, natural language processing, computer vision, data visualization and IoT on SAS Viya, powered by Microsoft Azure.
For their 3rd consecutive participation, our international team (from Germany, Belgium and Luxemburg) of Data Scientists chose to cover a sustainable and humanitarian topic that they strongly cared about: building an end-to-end data product aiming at raising awareness and helping individuals in India to assess their climate-related risk, while empowering micro-insurances to identify particularly vulnerable people and reaching out to them with the needed coverage.
We all know that technology can and should also be used for humanitarian and sustainable projects. This project, completed in only a few weeks, is proof that with the right investment, the right knowledge and the right commitment, technology can better the world.
The end goal of the SAS Hackathon is to bring together sharp minds from many backgrounds to create a commercially viable solution for real-world problems. It’s a learning experience, an incubator and a trial for taking world-changing ideas to market.
– Einar Halvorsen, Global Hackathon Lead at SAS
Our Use Case: Putting Vulnerable Farmers and Sustainability at the Center
The insurance data we used has been provided by SAS and is real data from a microinsurance for tractor vehicles targeting low-income farmers in India. However, our approach can be generalized to other insurances beyond tractors and other regions in the world.
The dataset contains 28 anonymized parameters and a binary churn variable. It covers 763K customers, of those 65% have canceled the insurance. Most of the customers are middle-aged, and located in 25 states in India.
Besides the insurance data, we have been particularly interested in the effects of climate change on damage risk. To enrich the given data set, we added publicly available data on insurance damage and meteorological data and climate change forecasts for the years 1950 – 2100.
This dataset served to train a model in SAS Model Studio designed to predict churn events. Churn analysis is the process of using data to understand why customers stopped using a service, in our case: insurance. We identify characteristics that determine customers that are likely to cancel the insurance and predict a churn probability for each customer.
After running various Machine Learning models (incl. AutoML), the best model has been chosen. The champion Gradient Boosting model outperformed, among others, the random forest and logistic regression models, achieving a F1-Score of over 80% for predicting the probability to churn per client.
Using model interpretability features we could determine the key factors leading to churn and the best model for our case.
The variables with the highest impact on the churn rate are No Claim Bonus, State of residence, Age of the contract and age of the vehicle, namely the older the policy age, the less customers tend to quit. The factors leading to churn were used to identify and address customers by showing them their individual climate risks.
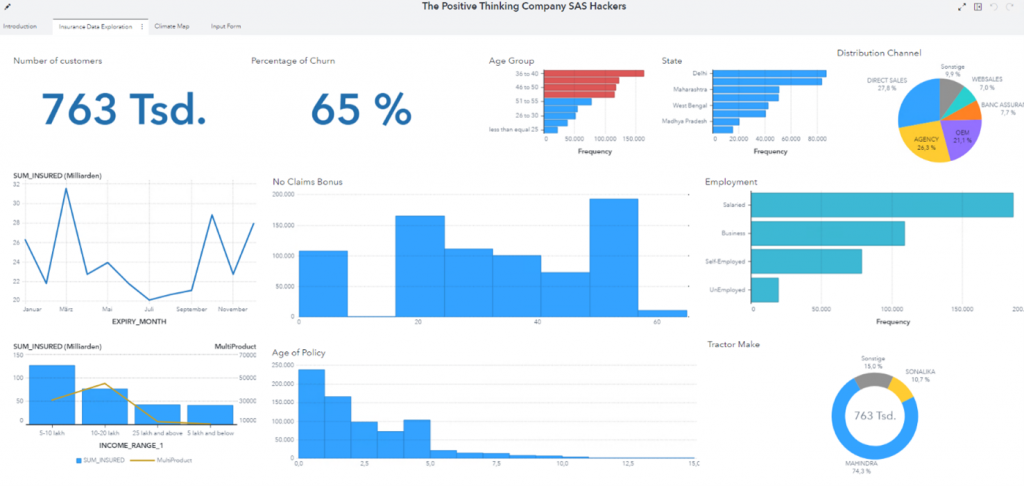
Dashboard Figure 1 – the Insurance Data Exploratory Tab:
This interactive data visualization informs about the most important parameters of the dataset. It is aimed at informing developers and insurances, and allows to explore interdependences.
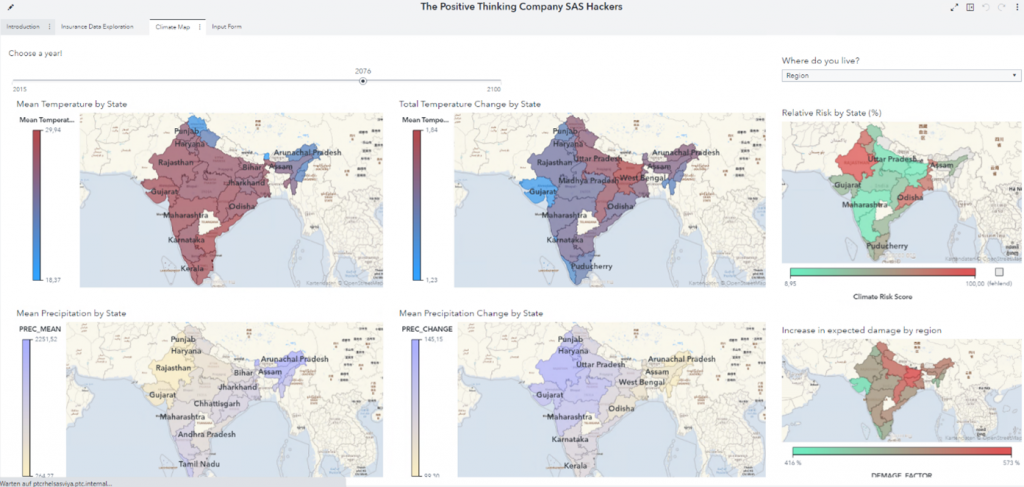
Dashboard Figure 2 – the Climate Map Tab:
Based on historical data, projections of key climate indicators are illustrated across time and geographical region. This interactive dashboard was built for insurances and customers alike and allows to explore climate developments, such as temperature and precipitation. Furthermore, the relative risk by state and the expected increase in climate-related damage are aggregated indices that help to inform individuals of their specific risk.
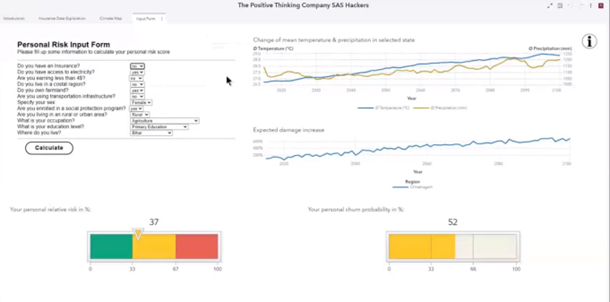
Dashboard Figure 3 – the Personal Risk Assessment Tab:
The (potential) customer is asked to provide personal information about their socio-economic situation, based on which individualized information are provided. Such as the expected changes in climate and associated risks of the state of residence, as well as the personal relative risk score. The latter provides an indication of individual risk potential in comparison to the entire population, which helps to understand the need to be insured, for the most vulnerable. Finally, the personal churn probability indicates how likely a customer is to cancel insurance based on their status and is designed to raise awareness of this risk. Personalized messages are shown for those at high risk and aim at helping them to be insured.
Using the data-driven content feature in SAS VA, we implemented a JavaScript-based interactive input form with a dropdown menu for each question for the customer. Additional fields can appear depending on the input of the previous questions. This information about the person’s socio-economic profile was fed into our model and together with weather, climate and geographical data were used to calculate a personal relative risk score and the expected damage increase in dollars. This was implemented by passing the input data to a python script where a model calculates the respective scores and loads the result back into SAS.
By bringing this use case to life, we can improve resilience to climate change for exposed farmers in India.
The SAS Hackathon Experience from the Inside
Participating in a Hackathon like this one is a great opportunity for our co-workers to put into practice their advanced knowledge and skills in Data and Analytics as well as work on new types of use cases. It’s obviously a great opportunity to collaborate with each other and to explore how far they can go by putting their heart and soul into something.
“It was really exciting to participate in this event. We had a great time, we were very stressed at times, but what a job accomplished! Great teamwork”

– Igor Shapiro, SAS Expert
“This has been a fun and rewarding task! Each member could be creative, evolve and learn a lot. We truly put our motto into practice by collaborating to better the world!”

– Lars Krieger, PhD SAS Expert
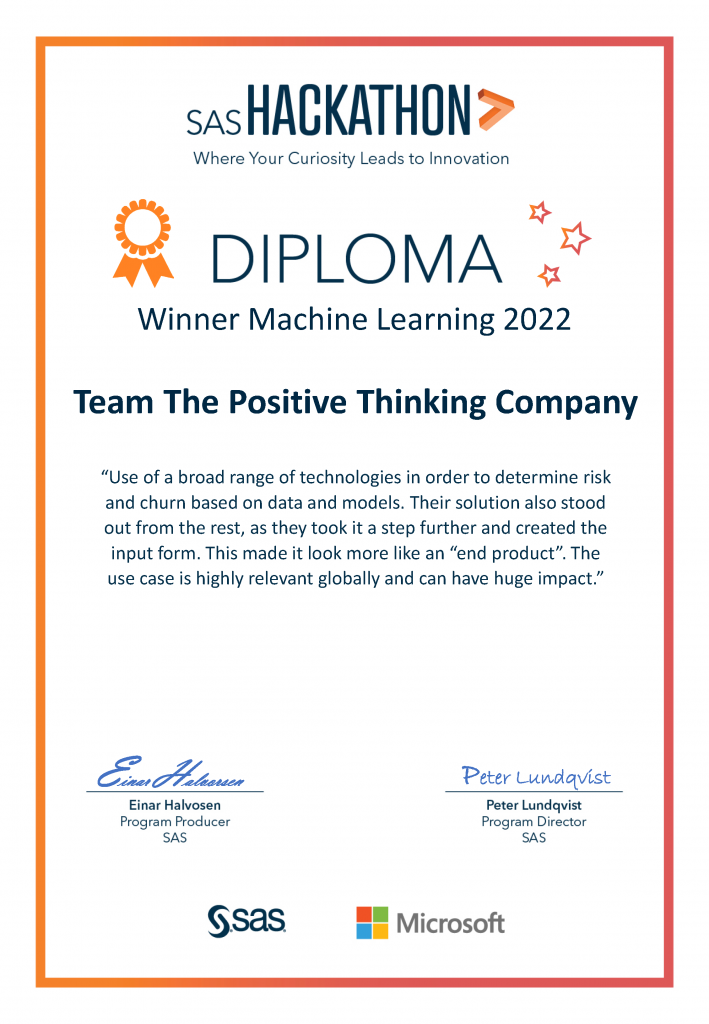
On behalf of the entire Positive Thinking Company, we celebrate our team’s participation in this Hackathon, their victory in the Machine Learning category and for taking on the challenge of covering a sustainable use case. Initiatives like this one make us believe, more than ever, that collaboration betters the world.
Thanks to our
Authors